
Recurring-revenue analytics for Pipedrive
Pipedrive shows your total subscription revenue. We show you why it changed.
MRR waterfalls, cohort retention, and NRR/GRR — computed straight from your Pipedrive recurring products. No spreadsheets or manual CSV imports — your reports stay current automatically.
Pipedrive Growth plan or higher · read-only access · ~2-minute setup
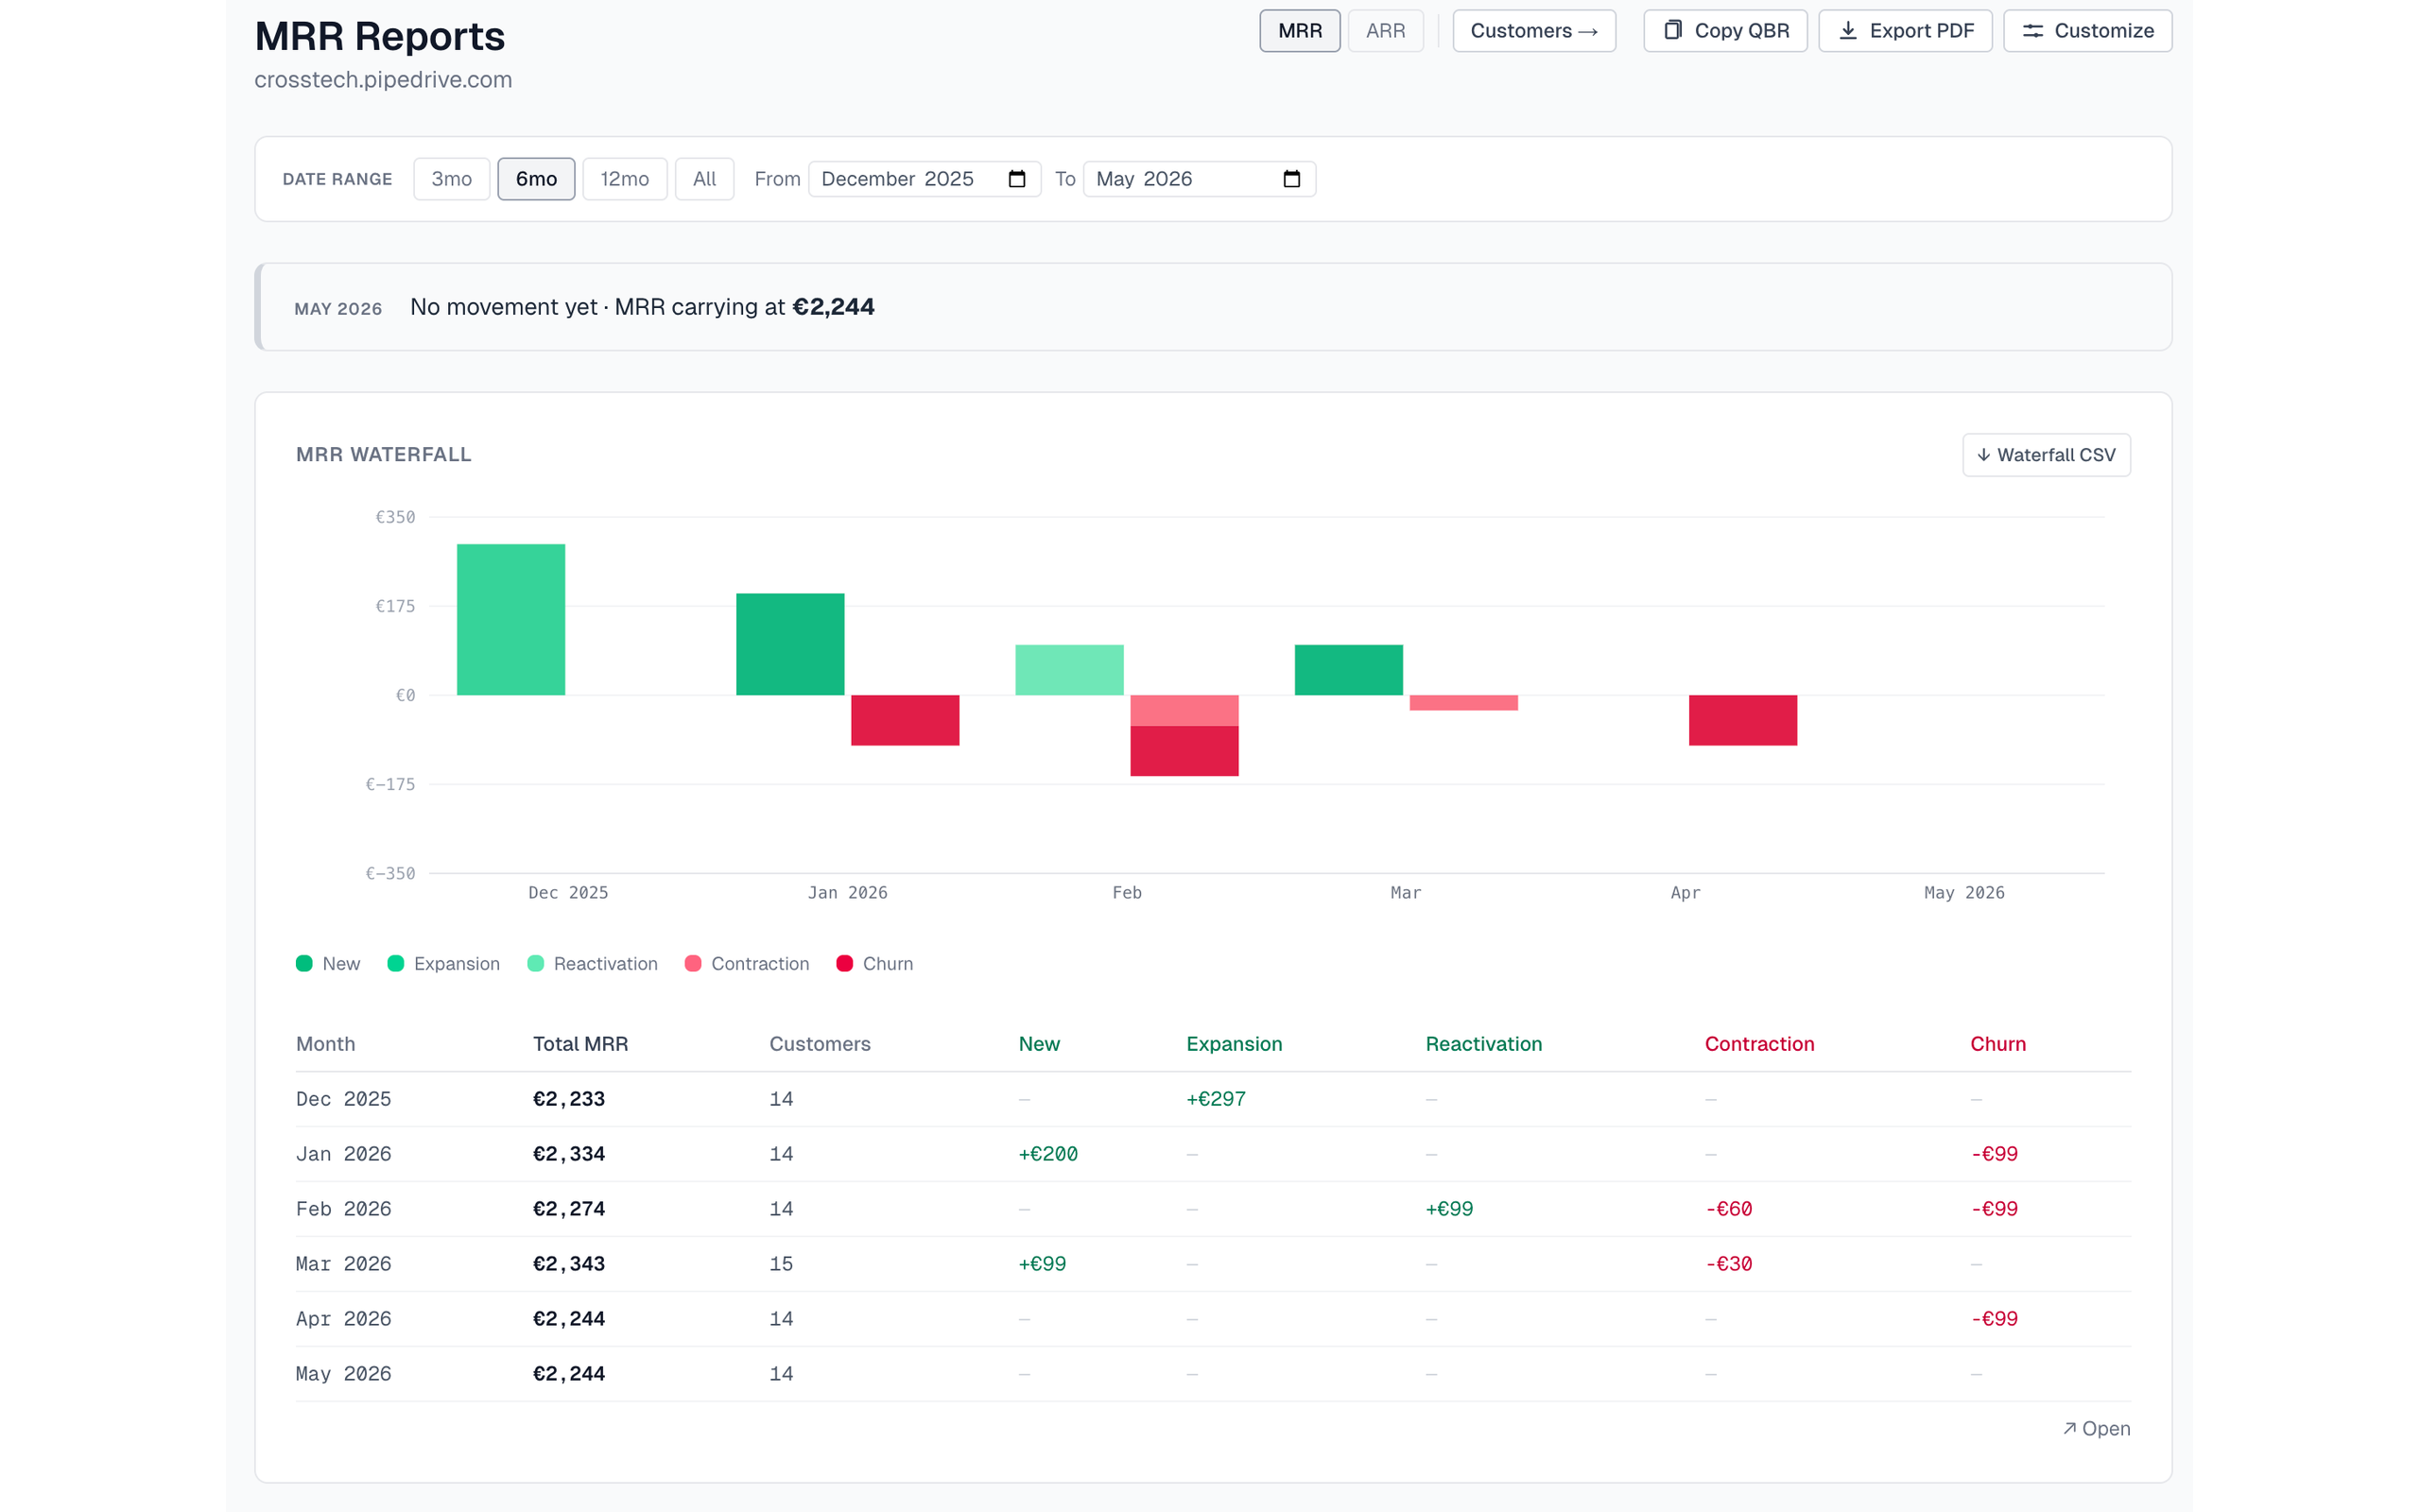
Every dollar of change, explained.
Each month splits your MRR into five movements — new, expansion, contraction, churn, and reactivation — so you see what actually moved the number, not just the total.
- 5-component monthly waterfall
- New · Expansion · Contraction · Churn · Reactivation
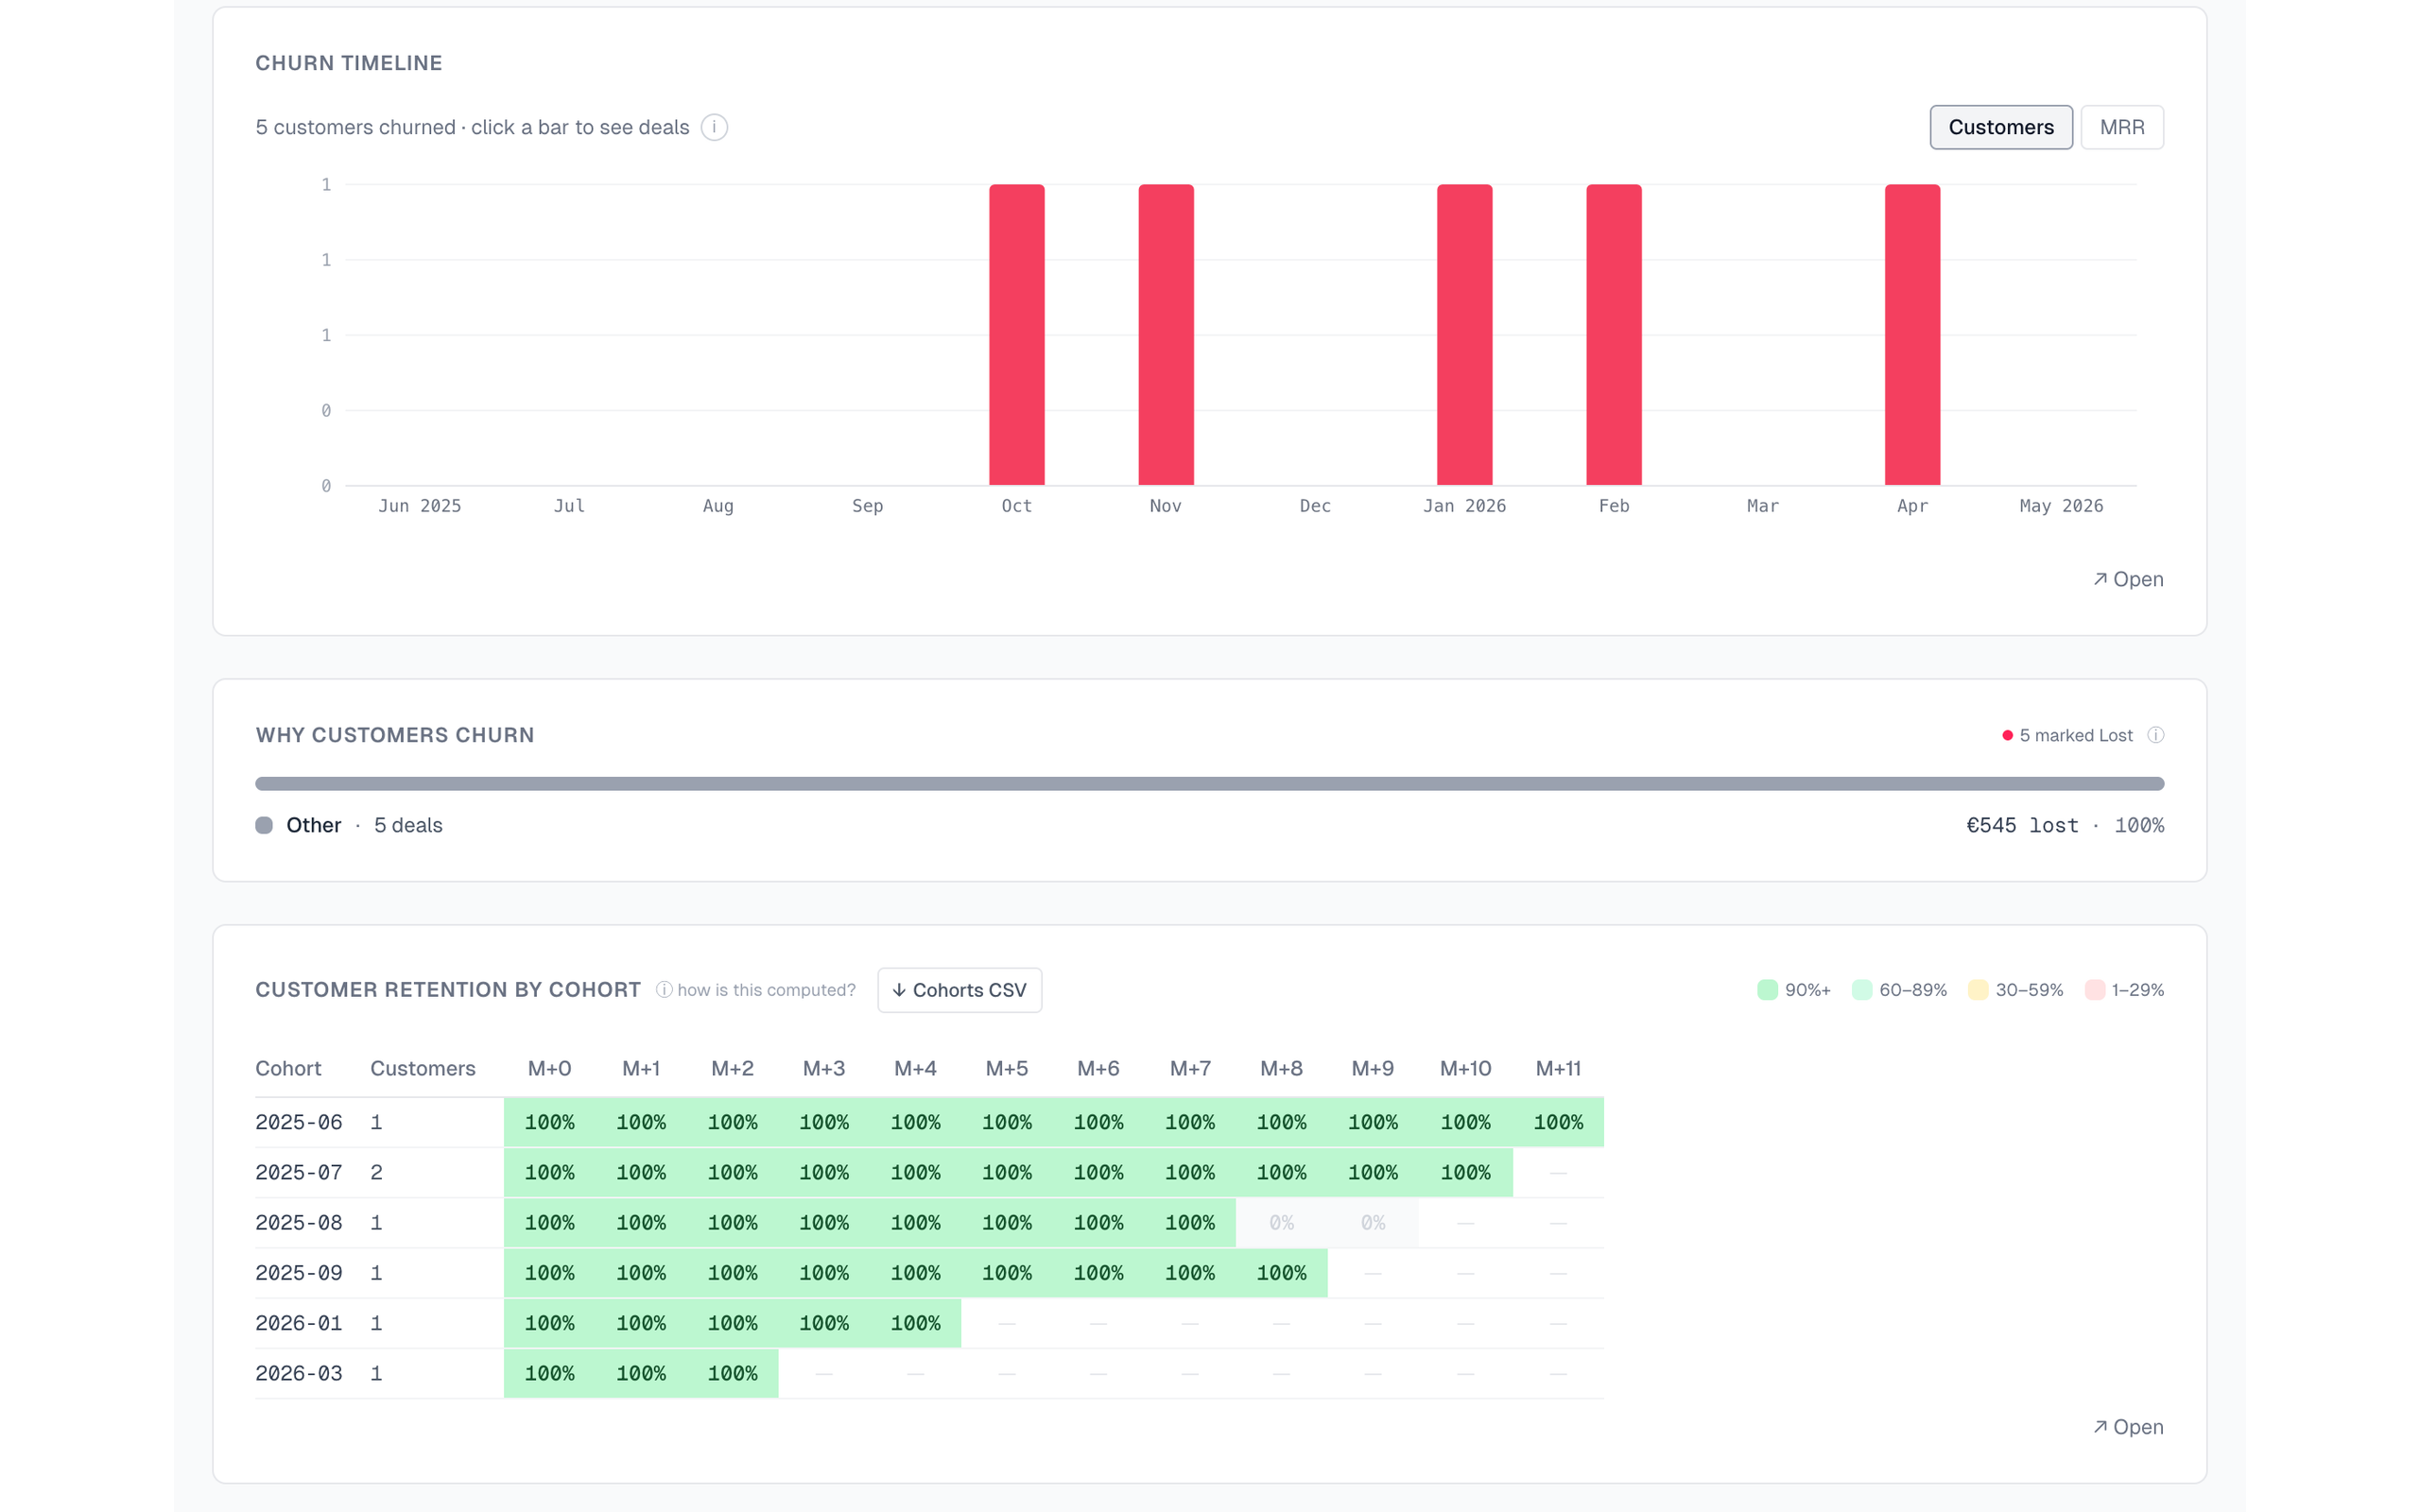
Which months bring customers that stay.
Group customers by the month they signed and watch each cohort retain over time in a color-coded heatmap. Spot the intakes that stick — and the ones that quietly leak.
- Grouped by acquisition month
- Retention curve per cohort
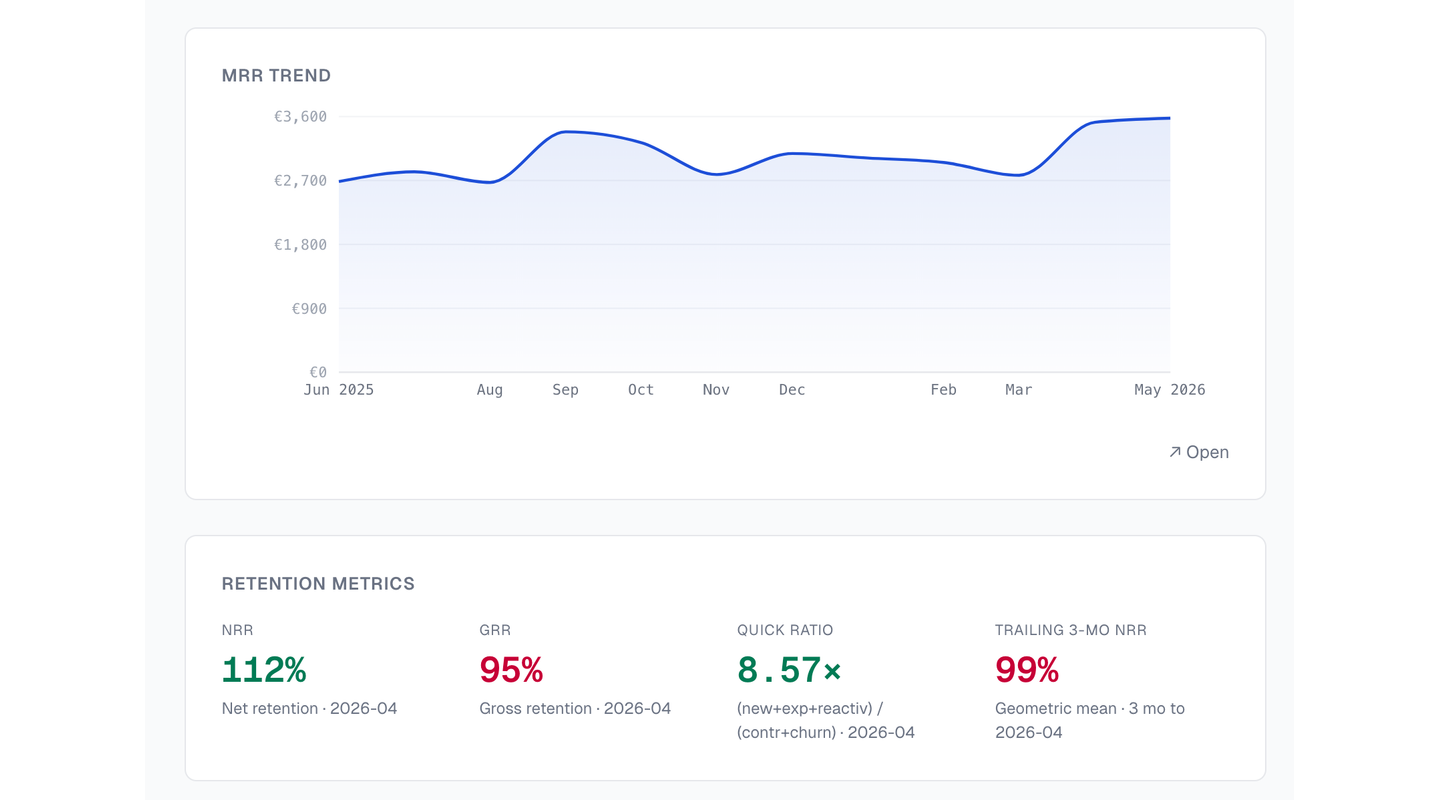
NRR, GRR & reactivation at a glance.
Net and gross revenue retention plus reactivation, tracked month over month alongside your MRR trend line — the health of recurring revenue in a single view.
- NRR · GRR · Quick Ratio
- Trailing 3-month NRR
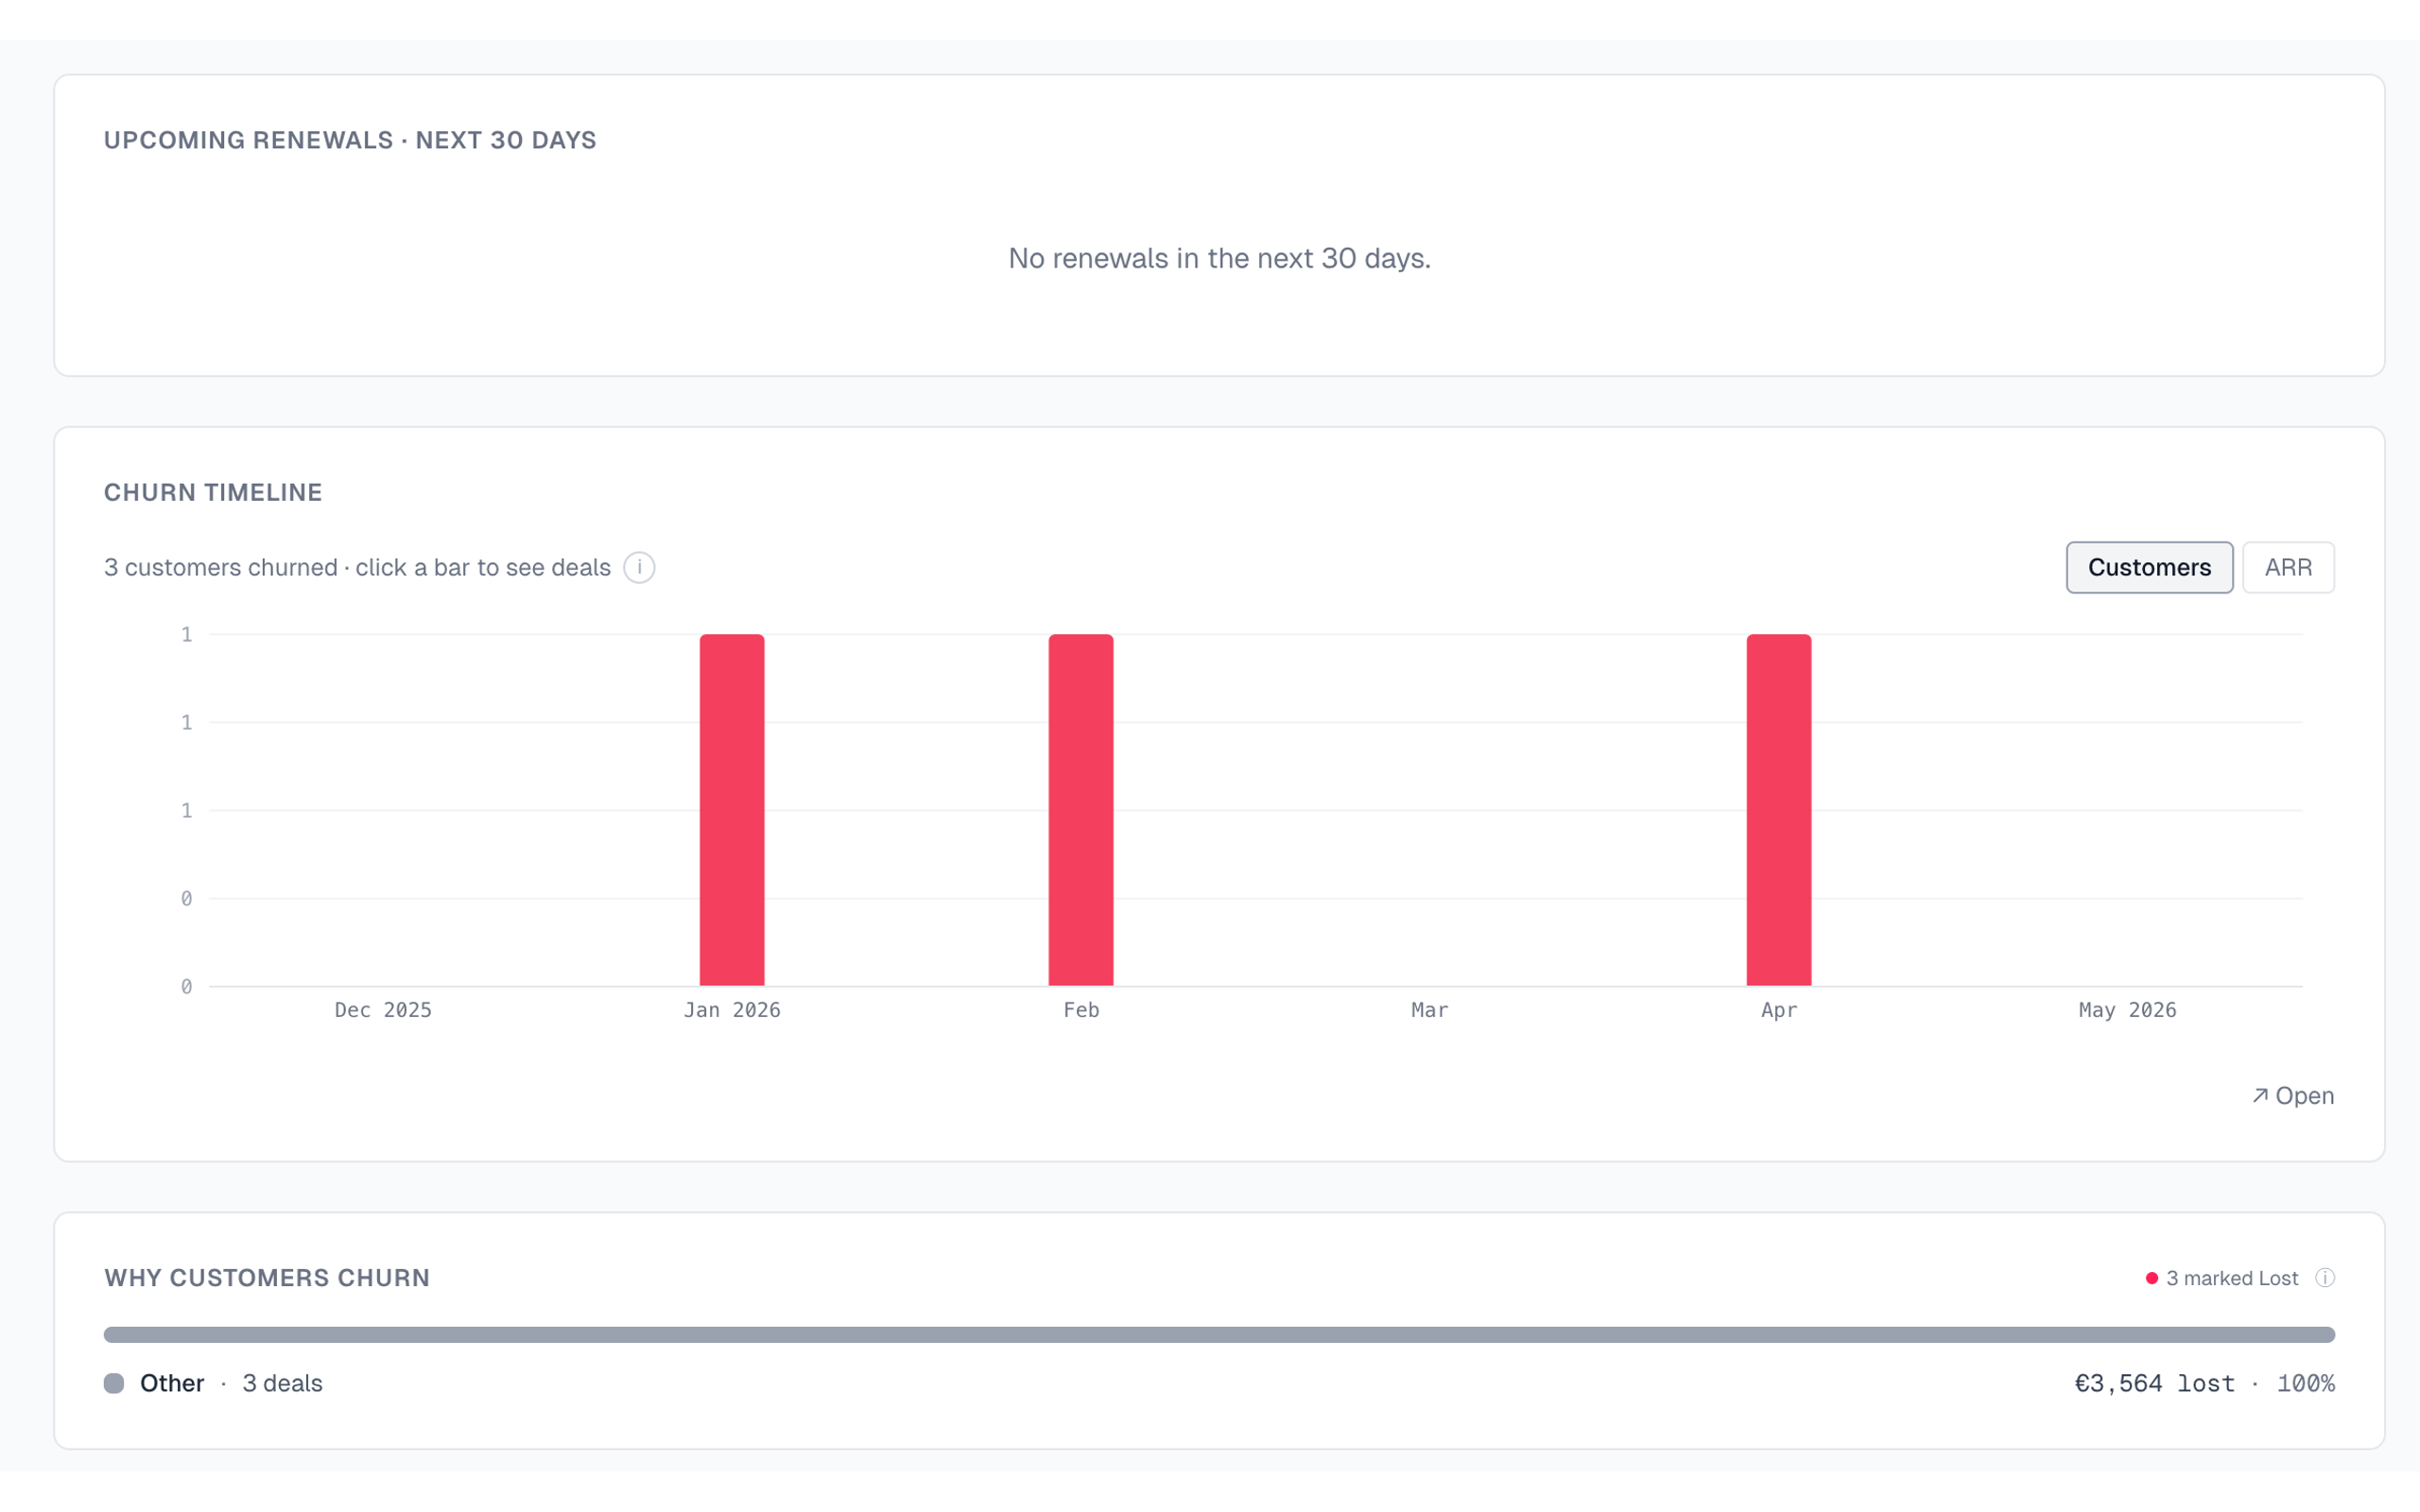
Know what's really costing you.
Break down churned revenue by the lost reason recorded on your Pipedrive deals, split marked-Lost from contract-expired, and rank the biggest losses by revenue at risk.
- Churn segmented by lost reason
- Biggest losses ranked by MRR
Setup
Live in two minutes.
Install from Pipedrive
Approve read-only access to deals, products, and user data, plus webhook management used only to keep reports current.
We read your recurring products
MRR is computed from recurring products on deals marked Won. Nothing to import.
Open the dashboard
Waterfall, cohort retention, and NRR/GRR — current and historical, kept in sync.
Stop guessing why MRR moved.
Turn your Pipedrive recurring products into a real subscription-revenue report — waterfall, cohorts, and retention, in minutes.
Install in Pipedrive→